
Scalping Trading Strategy: How Traders Analyze Short-
Term Market Opportunities
Introduction:

Scalping is a short-term trading approach in which traders try to take advantage of changes in prices in financial markets. Of keeping positions open for hours or even days scalpers often start and finish trades within minutes. This method is popular in forex, gold, indices and cryptocurrency markets.
Even though scalping can create chances to trade it needs a lot of discipline fast thinking and smart ways to manage risk. Small price changes can lead to gains. The cost of making trades sudden changes in the market and not entering at the right time can turn a good plan into a bad one.
Learning how scalping works what tools traders use and how to handle risk can help traders decide if this method is right, for their goals.
Popular Timeframes for Scalping
Scalpers often look at timeframes to study how prices move. Common options are the one minute chart, the five minute chart and the fifteen minute chart.
The one minute chart shows price changes and can give more chances to trade.. It also has a lot of random movement which can lead to incorrect signals.
The five minute chart gives a mix of quick details and a bigger picture of how prices are moving. Many traders use it to find places to enter a trade while also watching timeframes to see the overall direction.
The fifteen minute chart can help traders see the trend during the day. It can also help traders avoid making decisions based on every change, in price.
A trader might look at the fifteen minute chart to see where the market is going and then use the five minute chart to find a spot to enter a trade.
2. Relative Strength Index
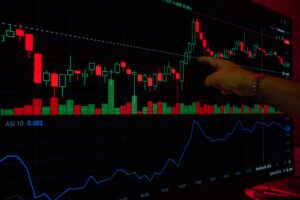
The Relative Strength Index usually called RSI looks at how strong recent price movesre using a scale that goes from zero to one hundred.
When the RSI is, above seventy most people think the market is overbought. When the RSI falls below thirty most people think the market is oversold.. Those numbers do not automatically tell us that the market will turn around.
In a trend the RSI can stay in extreme levels for a long time. Therefore a trader must also look at the trend how prices are shaped and other confirmation signals before deciding to take a position.
3. Support and Resistance
Support is a price level where buying has stopped a fall or pushed it back before. Resistance is a price level where selling has stopped a rise or pushed it down before.
Scalpers watch these levels for breakouts, rejections or retests.
A well‑structured trading strategy should set market conditions, entry rules, stop‑loss levels, profit targets and position size before a trade begins.
One example is a trend‑following scalping approach.
First identify the trend on a higher timeframe. Next find a pullback toward a moving average or a clear support zone. Wait until you see signs that the market will return to its direction for example a strong price candle or a break of a short‑term swing level.
Once the entry conditions are satisfied calculate the position size using the stop‑loss distance and the amount of capital you are willing to risk.
For example a trader with a five hundred dollar account who decides to risk half a percent, per trade would risk two and a half dollars on that trade before factoring in execution slippage.
This example only shows how to calculate risk; it does not mean every trader must use this risk level.
Why Trading Costs Matter
Trading costs are very important in scalping because the expected profit for each trade may be very small.
The spread is the difference between the buying price and the selling price. Some brokers also charge commissions. Overnight financing may also apply to positions that are held beyond times.
Slippage happens when an order is executed at a price that’s different from the price that was expected. Slippage can increase during announcements, sudden price movements or periods of low liquidity.
Suppose a strategy aims for a profit of $3 per trade.. The combined spread, commission and slippage average $1.50. The remaining amount, before costs is only $1.50.
This example shows why traders must evaluate results instead of focusing only on winning trades. Trading costs can eat up profits if not considered.
Back testing and Performance Evaluation
Back testing means using trading rules on market data to see how a strategy could have done in the past.
For example a strategy that wins 60 percent of its trades is not always profitable. The average losses might be much bigger than the wins.
Testing needs to include spreads, commissions and slippage as much as possible.
After doing back testing demo trading can show problems, like slow execution and trouble sticking to rules all the time.
Scalping gives a way to take part in changes in the financial markets but it is not a simple or sure way to make money.
A better way to do things uses discipline. It includes looking at the market setting rules for when to enter, having realistic goals, for profit managing how much to trade and checking performance regularly.